Process Design & Quality Assurance

Conceptually, chemical strengthening is a simple process. In practice, the process is influenced by a number of factors, and the results vary considerably. It is often difficult to determine whether a particular treatment has produced the desired effect. This is because a quantification of glass abrasion during product manufacture, as well as during subsequent application, is difficult.
Strength as measured by the average modulus of rupture (MOR) is often used to assess the effectiveness of a particular treatment, but the results can be misleading. One cannot design an appropriate treatment based only on average MOR, and while average MOR is useful as a quality control test, it must be used with caution and only in conjuction with other measurements, such as those which provide an indication of:
The depth of the compression layer – i.e. what is the case depth?
The magnitude of the surface compression stress.
A statistically meaningful description of the distribution of MOR values.
Some measure of the sensitivity of the strengthened glass to handling/abrasion/impact.
Saxon Glass uses all of the above in designing processes appropriate for a given product. Optical as well as chemical determinations of case depth may be carried out, together with effects of controlled damage on MOR. In addition, statistical analysis is used on representative samples from each strengthening run.
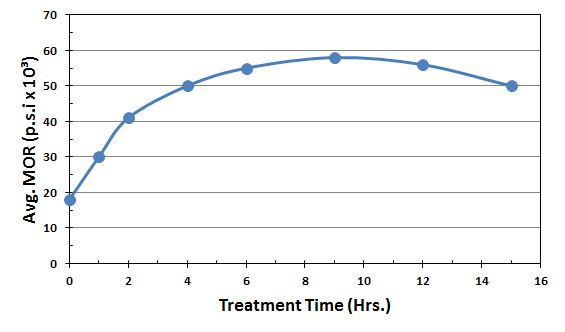
An effect of the inadequacy of MOR is provided in Figure 2 which illustrates the effect of treatment time on the average MOR of float glass. Note that the average MOR increases rapidly for short treatment, levels off, and then appears to decrease for longer-term processing. This behavior is typical of chemical strengthening and is due to “stress-relaxation” effects, which reduce the maximum surface compression.

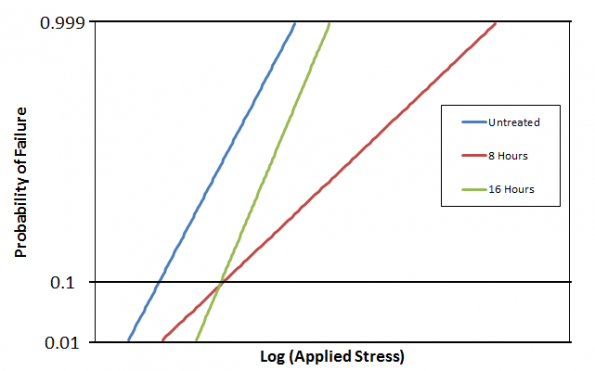
The higher MOR at shorter treatment times is misleading. Because the standard deviation tends to decrease with increasing treatment time, longer ion exchange does improve the product. This is shown in Figure 3, which compares the strength distribution for untreated samples and those treated for 8 hours and 16 hours. Note that for the long treatment times, fewer samples failed at either very high stresses or at very low stresses. While the average strength after 16-hour treatment decreased for thin glass, the fact that there were fewer weak samples is usually the most important factor, since it is the weakest samples that fail in service – not the strongest. This greatly benefits quality assurance.
In the example shown in Figure 3, a design strength which permits 10% failures is equal for the two treatments. However, for a smaller percentage failure, the design strength is higher for the 16-hour treatment.